User Interface & Views
GUI - Graphical User Interface
The main application screen consist of:
- The Main View(s)
- The ActionBar including the main menu
- The StatusBar (can be disabled)
- The NavigationBar (if a path is loaded)
The Main View(s)
The application supports up to three different views visible at the same time - the main view and two additional Sub Views (I+II). You can:
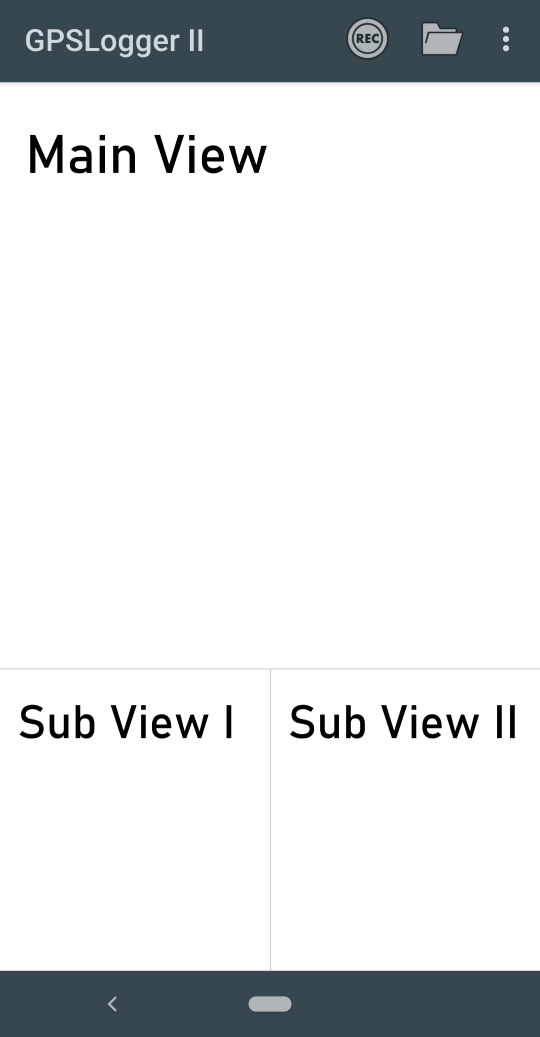
- Fully customize which view will be used in each of the three available sections
- Switch between all the available views by swiping left/right (on a map view you have to start with
- the swiping near the left/right margin of the map screen)
- Specify the ratio between the main- and the two sub-views (default is 1:1, the screenshot shows 3:1 - the ratio between Sub View I & II is always 1:1)
- Define, if a sub view should be locked (view switching will be disabled)
- The two additional views can be enabled/disabled via the main menu (Show/Hide View 1 and Show/Hide View 2)
All the view configurations can be adjusted in the Appearance & Startup Settings, so that the application will start with the screen layout you prefer.
Please note that TabBar is not visible when multiple views will be displayed. Then the only remaining option to change
the current view is by swiping left/right.
The ActionBar
The ActionBar will be only visible when you are in the view-mode of the application - as soon as you start recording the ActionBar will be hidden, and you can access the main menu via the corresponding overlay button.
If enough space on your display the ActionBar will show (beside the
menu) the
 Start Recording Button & the
 Open PathManager
ActionButtons.
Open PathManager
ActionButtons.
Additionally, the action bar show a Tab(ulator)Bar that allow you to quickly switch between the current active main-view. Please note that the TabBar will be only shown if the main view is active only and can also be disabled via the application settings.
When you make use of the Multi-Preferences feature the ActionBar will show the current active profile name instead of GPSLogger II.
The StatusBar
- Can be configured to be rendered as overlay or as own screen part
- Fields are fully customizable (including the option to toggle between the use of Emojis or Text)
Appearance & Startup Settings - Showing the recording status as first entry:
- [L]: logging/recording
- [P]: paused (lower case [p] indicates that the pause was triggered by the AutoPAUSE feature)
The NavigationBar
 The navigation bar is only visible when you have loaded a recorded path (or after you have stopped the recording) Beside
the slider that allow you to move quickly to any position in the recorded path (timeline) you have the option to use the
media-control-buttons:
The navigation bar is only visible when you have loaded a recorded path (or after you have stopped the recording) Beside
the slider that allow you to move quickly to any position in the recorded path (timeline) you have the option to use the
media-control-buttons:
| Icon | Description |
|---|---|
 |
Jump to the START of the path |
 |
Move 15 records back |
 |
Move to previous record |
 |
Move to next record |
 |
Move 15 records forward |
 |
Jump to the END of the path |
Please note, that not all records have to be location records - so moving one record backwards/forwards might just select a different record type (see How GPSLogger will log your data?)
Additional Overlay Buttons
The app wil show some additional buttons as overlay over the Main View - the appearance of each depends on from the
current use case and logging state. E.g. the  will be only shown when the app is recording (and the ActionBar is hidden).
| Icon | Description |
|---|---|
|
Opening the main menu of the application |
 |
The compass, in the upper left corner of the map, can be used in order to toggle the map orientation: Always North or Current Heading |
 |
Pause the current recording (when the recording is paused the overlay button will slightly pulse) |
 |
Stop the current recording (only visible if device is not in lock state) |
 |
Iterate between the different configured OpenMapData Providers |
 |
Center map on current position (only visible if map view is paned) |
 |
Center map on next (navigation) target (only active when a navigation path is loaded) |
 |
Zoom IN (only visible if one of the visible views supporting zoom function) Pinch-to-zoom is also supported |
 |
Zoom OUT (only visible if one of the visible views supporting zoom function) Pinch-to-zoom is also supported |
 |
Reset Off-road Navigation (only available if a navigation path is loaded that does not contain turn-by-turn instructions) |
 |
Calculate new next Waypoint (only available if a navigation path is loaded that does not contain turn-by-turn instructions) |
The available Views
In the following section some sample screenshots of the different views can show overlay buttons, others does not. The appearance of the overlay buttons can depend on the visibility of a certain view but don’t have too. In the following sections the overlay buttons will not be described - since they might not belong necessarily to the view.
OpenMapData View
GPSLogger have implemented two different Map views - depending on your Android Version and your device you can use the vector data based map rendering or an image based map rendering.
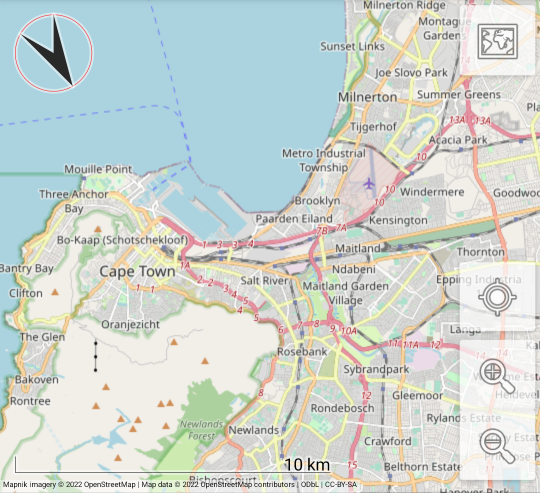
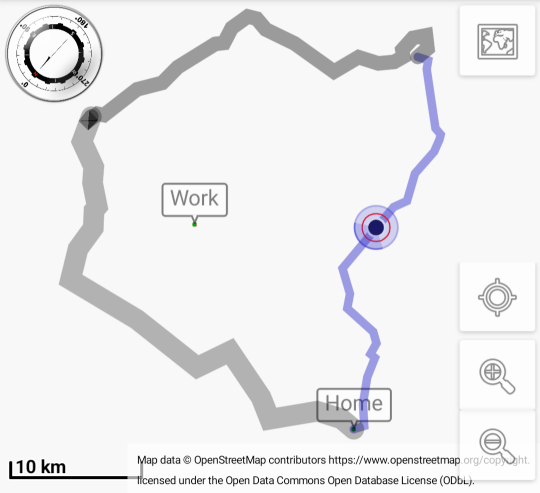
Vector tile based (using native OpenGL)
GPSLogger makes use of the VTM (Vector Tile Map), that was developed within the OpenScienceMap project. VTM makes use of OpenGL which implies that it is extremely fast. The VTM library is provided by mapsforge.
 Map features & interactions:
- The map image will be generated on the fly using OpenGL
- The map can be zoomed seamless
- The map can be rotated (textual information will be aligned based on the rotation)
- The map can be tilted (touch & hold with two fingers & move fingers up or down)
- Buildings will be rendered in 3D
- Supporting also image tiles [of course with the limits of image based map data (zoom steps, suboptimal text display and other things)]
To use the full power of the VTM map should use an open map data provider that will deliver vector tile data. This is
either the OSM OpenMapVectorTiles (online) provider (mapzen) or the OpenStreetMap (Offline) provider (working with
local *.map files). Details about the different map tiles provider can be found in the OMD Section of this manual.
When you use the OpenMapData provider called OpenStreetMap (Offline), then the map will be created on base of so called Render Theme. In such a theme the styling of each part of the map is defined (streets, rivers, bridges, tunnels, land usage, etc…). A Render Theme can have own options that would allow you to select different layers or even language preferences that should be visible on your map (see Render Themes for details).
The VTM Map is only usable as the Main View of GPSLogger. The Secondary View I+II use the second type of the map view.
I did not manage to implement 3 different VTM maps on a single screen, running simultaneously without any stability issues. That’s the reason why I decided for this workaround (VTM Map only in the Main View).
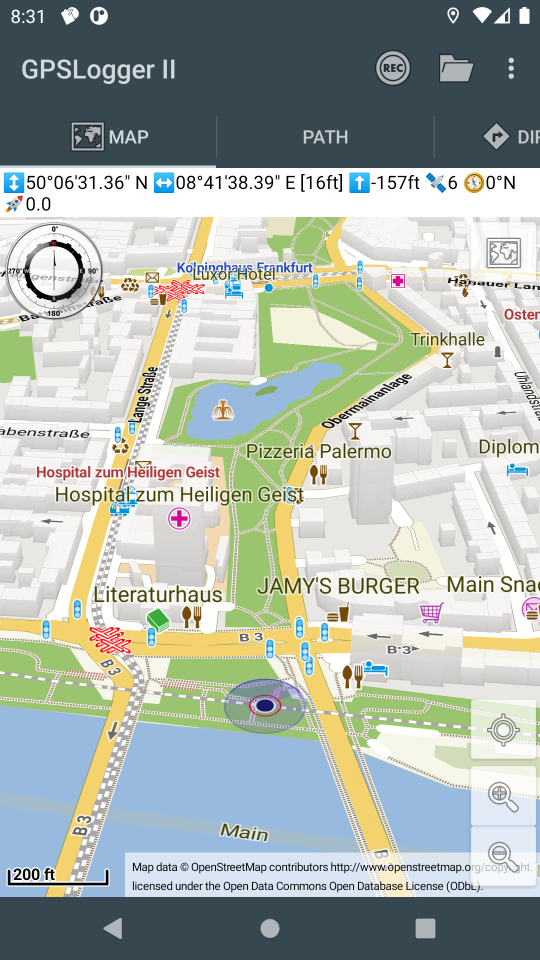
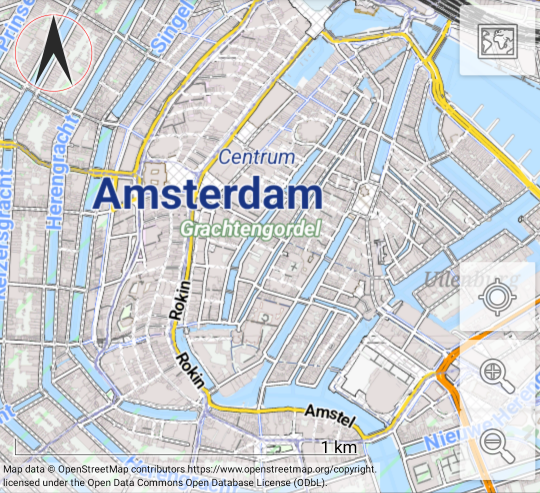
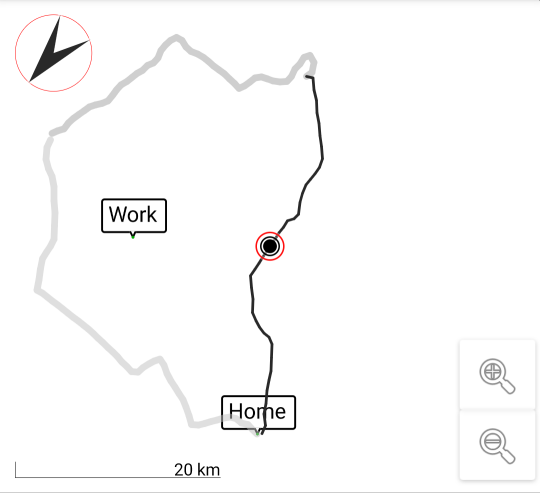
The simplest way to distinguish between the two different map versions is the compass in the upper left corner - if it’s the complex compass image then it’s the VTM map, if it’s the simpler black arrow, then you are dealing with the image tile based map version.
Image Tile based
This map view using pixel based images to display a map. The map will be assembled from multiple images - so called tiles. This tile images can have two different sources:
- Online Image Tile Server
- Images created from locally stored *.map files (via the Mapsforge library)
No matter if you use an online tile server or the local created images - once GPSLogger have downloaded or created a tile image it will be locally cached in an internal database, so it can be reused later. This means that you are able to use an online OpenMapData Provider even when you are offline, if all the required image tiles of a specific region are already stored in your local cache.
Supported map interactions:
- The map can be zoomed in steps (since each zoom level have the half/double resolution of his predecessor)
- The map can be rotated (but since the image is pixel based the texts will also be rotated as they are)
- The map can be panned (only if the map is aligned to North - so you can either rotate or pan)
Online Image Tile Server
 Here on this screenshot you see the OpenStreetMap Carto Style from their none public tile server (see OSM Tile Usage
Policy).
Here on this screenshot you see the OpenStreetMap Carto Style from their none public tile server (see OSM Tile Usage
Policy).
In general every TileServer that delivers images (in the required projection) can be configured & used with GPSLogger as
long as the server supporting public http(s) access.
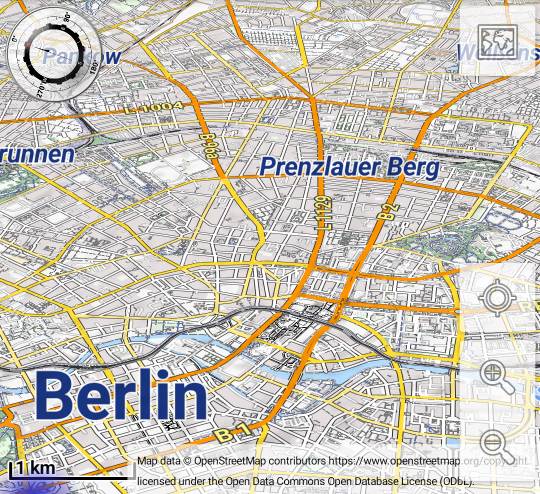
Mapsforge (OSM Offline *.map files)
When you use the OpenMapData provider called OpenStreetMap (Offline), then the image tiles will be created with the help of a so called Render Theme via the Mapsforge library locally on your device. In the render theme the styling of each part of the map is defined (streets, rivers, bridges, tunnels, land usage, etc…). A Render Theme can have own options that would allow you to select different layers or even language preferences that should be visible on your map (see Render Themes for details).
 Here in this example screenshot you see the Elevate Render-Theme (created & maintained by Tobias Kühn)
Compass View
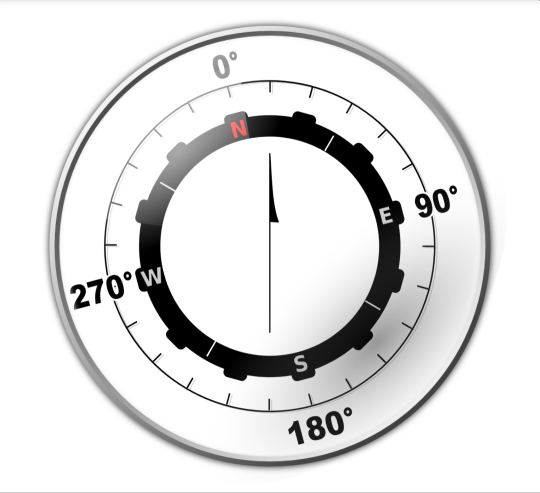 A very basic view - displaying your current direction, where the needle is static (pointing up) and
the N is pointing into the direction of the magnetic north. When your device have a
build in magnetic sensor then the app can behave like a physical compass.
A very basic view - displaying your current direction, where the needle is static (pointing up) and
the N is pointing into the direction of the magnetic north. When your device have a
build in magnetic sensor then the app can behave like a physical compass.
My personal experience with the magnetic sensor is, that the overall power consumption is significant higher when the sensor is enabled in the application settings, It can be very useful e.g. when GeoCaching but it really depends on your individual use case (if it’s worth the additional power consumption).
Special Thanks to Rob Antonishen for the very nice compass svg file and granting the permission to use it in the app.
Speed View
Speed information based on the GPS signal can be is very flaky. In order to smooth out the noise in the GPS speed
information GPSLogger applies by default an average median calculation when displaying the speed information. The grey
graph show you always the result of this internal calculation. [Taking the set of the last max. 10 speed values, order
them, remove the first and the last (so removing the min. & max.) and then calculate the average value of the remaining
set.]. You can disable the speed smoothing via Application Settings > General Settings > GPS-Sensor & Smoothing
Settings > Smooth Speed
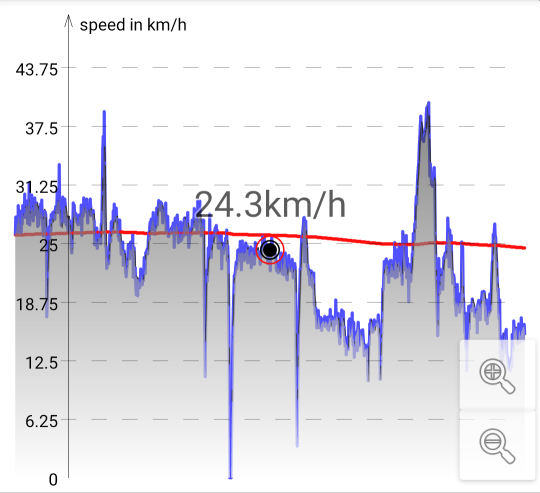
- Graph red: Showing average speed over time (always calculated based on overall distance & overall duration)
- other: depends on the combination of two application settings -> see table below
| Overwrite GPS-Speed | Smooth Speed | Graph: | Graph blue: |
|---|---|---|---|
| Speed information from the GPS fix | -none- | ||
| Speed information based on the distance & time | Speed information from the GPS fix | ||
| Average median speed value (from GPS fix) of max. last 10 sec. | Speed information from the GPS fix | ||
| Average median speed value (from distance & time) of max. last 10 sec. | Speed information based on the distance & time |
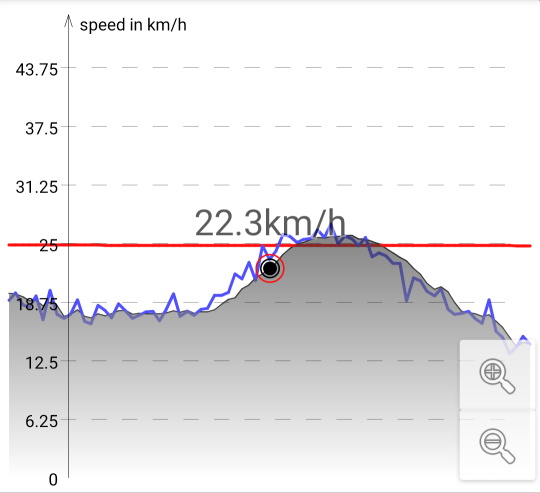 The difference between calculated median speed and the original GPS speed is not really noticeable in the overall view -
but when you start to zoom in, you can see the difference (it’s very typical that the original gps speed is jumping
up & down).
The difference between calculated median speed and the original GPS speed is not really noticeable in the overall view -
but when you start to zoom in, you can see the difference (it’s very typical that the original gps speed is jumping
up & down).
Elevation View
Elevation information from the GPS signal can have multiple issues. The challenges are different compared to speed data, but the overall challenge remains the same: the original data is not really suitable to be displayed 1:1. Details about the possibilities to enhance elevation data can be found in the Elevation Data optimizations section.
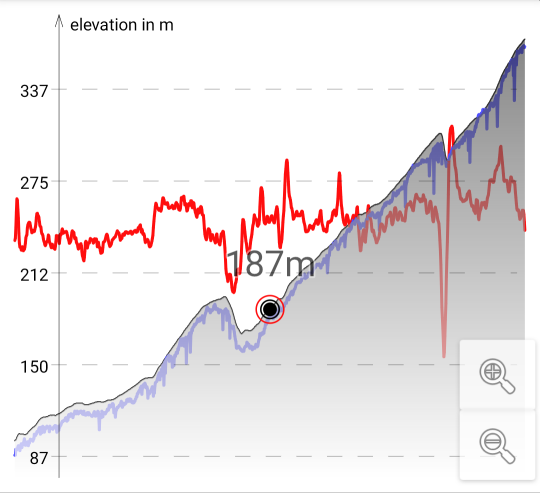
- Graph: Showing elevation data over time
- Graph red: Showing slope/grade over time (min/max -/+33%)
- Graph blue: If present, then showing the original elevation data from the GPS Sensor. This is the case, if in the
Barometer Sensor settings Use as Elevation provider or if additional
smoothing will be applied after path loading
Direction View
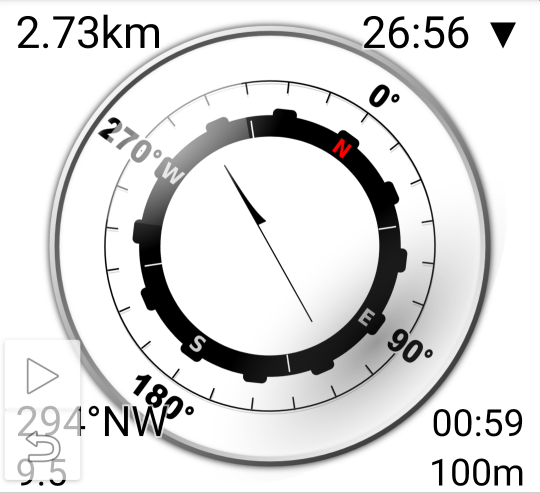
- The compass rose N is pointing into the direction of the magnetic north.
- The compass needle is pointing into the direction (as the crow flies) of your target (assuming you hold the device right in front of you)
- Upper left corner: Total distance to destination
- Upper right corner: Estimated time of arrival at destination (When you are currently moving faster than the average speed you will see an arrow pointing down, indicating that the estimated time of arrival might be lower, or an arrow pointing upwards to indicate that the time might be higher when your speed continue to be less than the overall average speed)
- Lower left corner top: Course to target waypoint
- Lower left corner bottom: Relative speed to target waypoint
- Lower right corner top: Estimated time of arrival at target waypoint
- Lower right corner bottom: Distance to target waypoint
GPS-Data View
When you want to use GPSLogger as simple GPS display, this is probably the view you would like to use. The view will display the current latitude and longitudes values (depending on your selected format) in the largest possible font so that both values are completely displayable on the selected screen size.
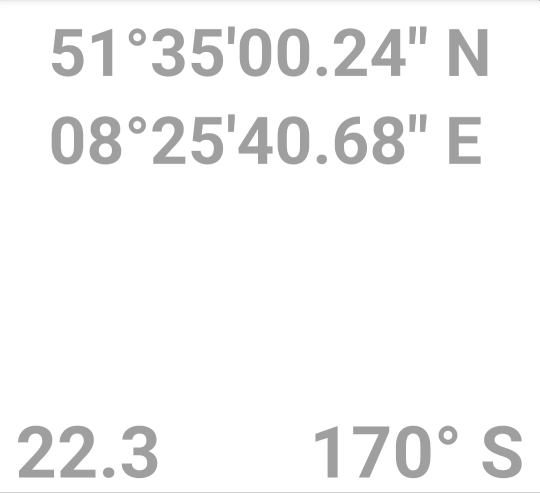
- 1’st row (maximum possible font size): Current Latitude
- 2’nd row (maximum possible font size): Current Longitude
- Lower left corner: Current Speed (without unit)
- Lower right corner: Current Course
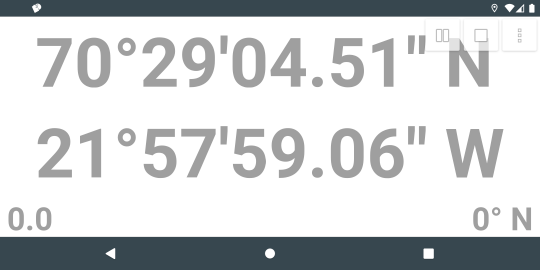 You probably want to use this View stand alone e.g. in your cockpit (boat - not aircraft!) in landscape mode to get the
maximum font size possible.
You probably want to use this View stand alone e.g. in your cockpit (boat - not aircraft!) in landscape mode to get the
maximum font size possible.
Navigation Views
Before the Multi View I-IV have been available GPSLogger had only the ability to display 3 different views at the same time (Main view & SubView I+II). The three available Navigation views have been implemented in order to allow the user to configure the screen depending on his personal use case. All the available information is also available as part of the MultiViews. See Multi View I - Multi View IV Section for details.
Direction View
Of course the core is the direction-to-go pointing arrow. This view assumes, that you have your device in front of you while moving (actively looking onto the device display).
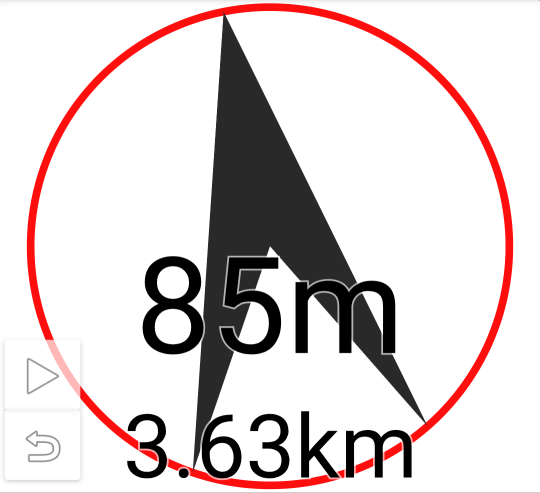
- Arrow: pointing in the direction (as the crow flies) of the next navigation target (can be a TurnByTurn position or a Off-road navigation waypoint)
- Medium Font middle: Distance to the waypoint
- Medium Font bottom: Remaining overall distance after the waypoint
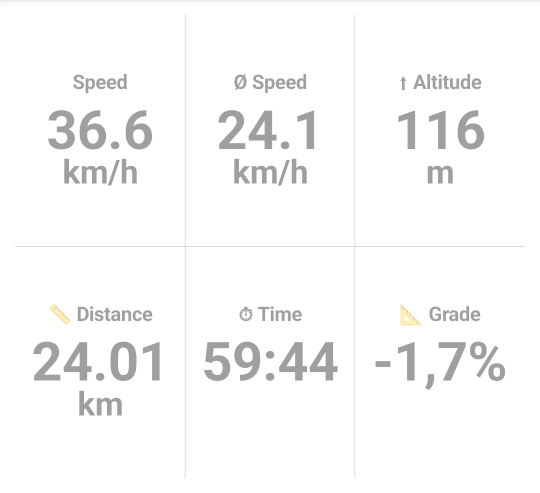
Distance & Timing View
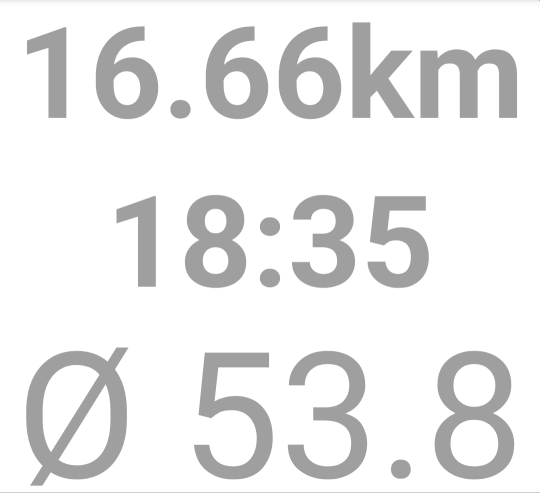
- Medium Font top: Total distance/length
- Medium Font middle: Total time/duration
- Medium Font bottom: Average speed (without unit - so here in the example 53,8 km/h)
Speed View
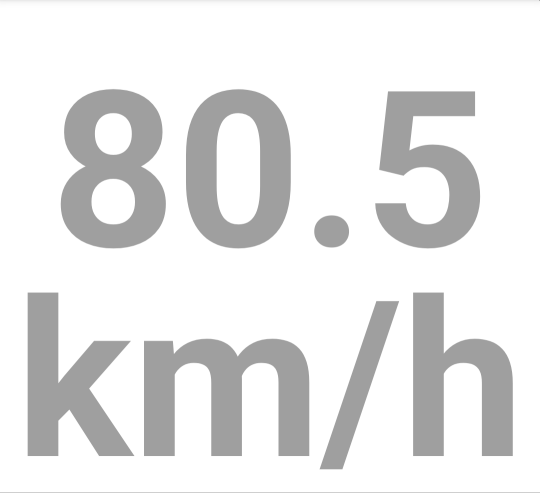
- Large Font top: Current Speed
- Large Font bottom: Speed unit
Heartrate View (ANT+/BTLE)
Data for the Heartrate View is only available if you have paired a BTLE/ANT+ Heartrate Sensor with GPSLogger. Please see External Sensors / Heartrate for details.
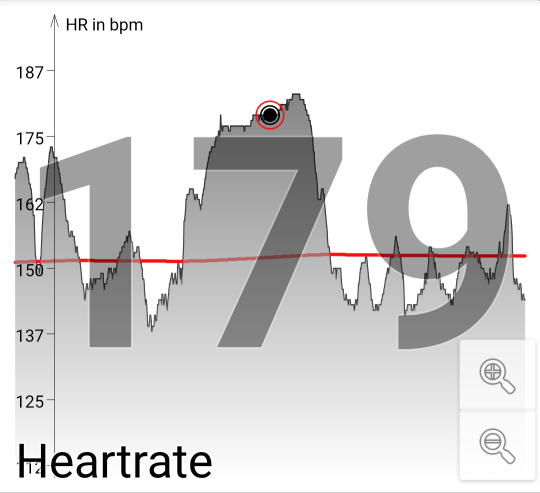
- Large Font: Showing current heartrate/pulse either in beats per minute or in a % value of you maximum pulse (see Settings)
- Graph: Showing heartrate/pulse over time
- Graph red: Showing average heartrate/pulse over time
Cadence View (ANT+/BTLE)
Data for the Cadence View is only available if you have paired a BTLE/ANT+ Cadence Sensor with GPSLogger. Please see External Sensors / Cadende for details.
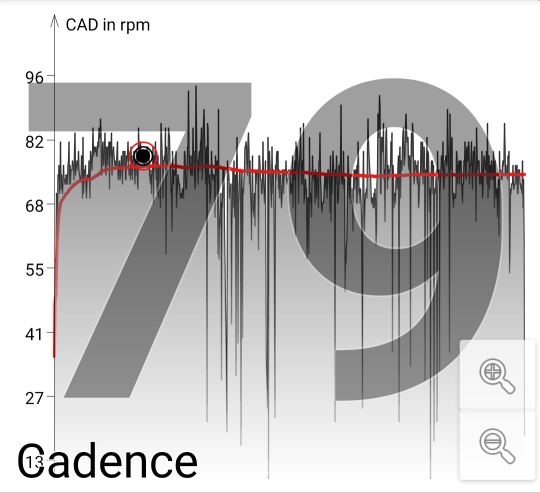
- Large Font: Showing current cadence in rotations per minute (rpm)
- Graph: Showing cadence over time
- Graph red: Showing average cadence over time
Shifting View (Di2)
Data for the Shifting view is only available if you have connected your Shimano Di2 with GPSLogger. Please see Shimano Di2 Support for details.
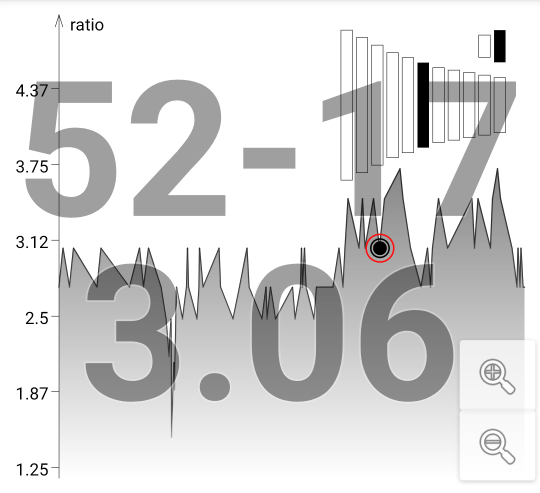
- Large Font top: Number of front-gear teeth - number of rear-gear teeth
- Large Font bottom: resulting gear-ratio
- Upper right corner: Schematic gear positions
- Graph: Showing ratio over time
Power View (BTLE)
Data for the Power View is only available if you have paired an BluetoothLE Power Sensor with GPSLogger. Please see External Sensors / Cycling Power for details.
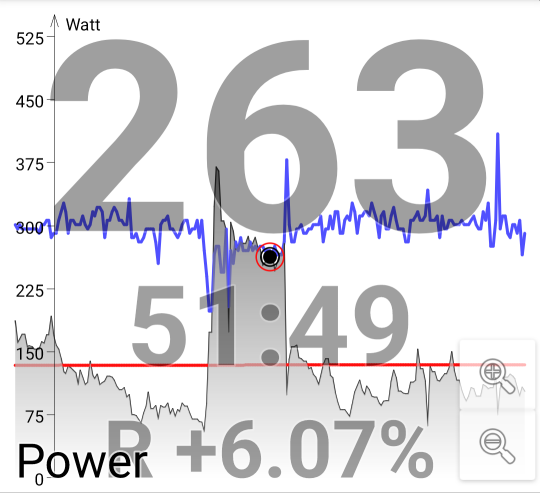
- Large Font top: Current cycling power
- Medium Font middle: Current ratio between left & right leg (balance - here in the example left leg provided 51%, while right delivered just 49% of the 263 watts)
- Medium Font bottom: the average balance between left & right (here in the example the right leg provided in average 6.07% more power than the left)
- Graph: Showing cycling power over time
- Graph red: Showing the average power
- Graph blue: Showing the balance between left & right leg over time (lower than half of the screen: left leg provided
more power, over the half of the screen: right leg provided more power)
Barometer View
Data for the Barometer View is only available if your device have build in a barometer sensor and if you have enabled the Barometer Sensor in the Application settings.
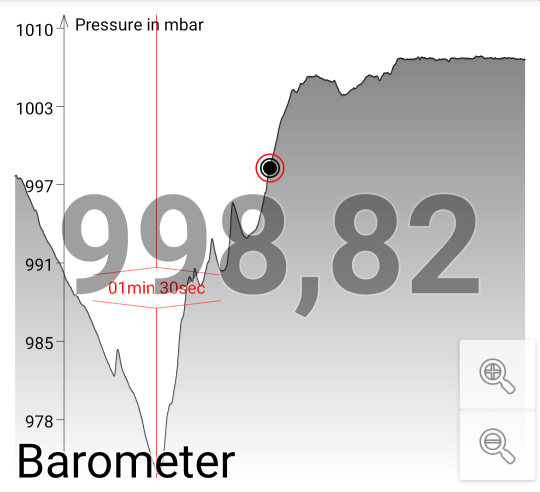
- Large Font: Showing current pressure in millibar
- Graph: Showing pressure over time
Here in the sample screenshot you also see how a pause in the recording data will be rendered in the different time axis
based views. In this example the pause took 1 minute and 30 seconds.
TargetSpeed View
Implemented for a specific use case of a friend - mainly give you a target speed based on the current slope.
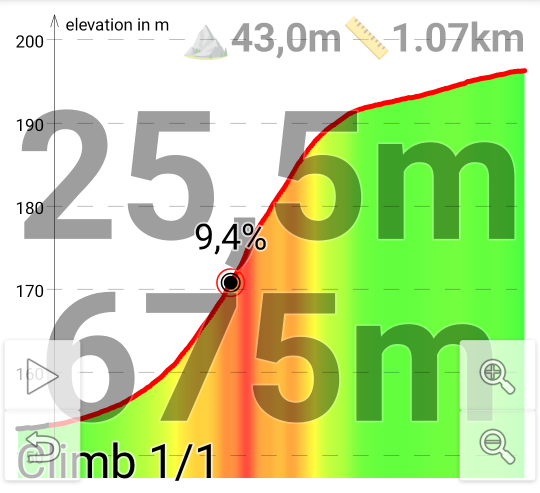
Climb View
The Details about the Climb are described in a separate section of this manual
MultiView I-IV
The Details about the Multi View I - Multi View IV are described in a separate section of this manual
BTLE-Beacon View
Data for the BTLE-Beacon View is only available if you have enabled the build in BluetoothLowEnergy beacon scanner and you have started the recording process. Please see Build in BluetoothLowEnergy Beacon Scanner for details.
![]()
- Large Font: Showing current visible beacons
- Graph: Showing number of visible beacons over time
Path View
The Path View is the initial created view of GPSLogger - so everything have started from there. At the first days of the application there was almost none map support on the BlackBerry Platform available. So the initial approach of GPSLogger was to show the user a x-y-axis graph of his path. This might also explain, why the activities/tracks/routes that you record with the app have the internal name path.)
 The Path view is drawing the latitude/longitude positions
on a simple X/Y axis without any projection. This means, that each pixel on the display have a different length or
height in the real world.
The Path view is drawing the latitude/longitude positions
on a simple X/Y axis without any projection. This means, that each pixel on the display have a different length or
height in the real world.
This seams to be ridiculous bad from today’s point of view - but hey I was young and needed the money! What else can I say as lame excuse. Seriously this view is just included in GPSLogger for nostalgic reasons. I don’t expect that any current user have this view enabled.
The Path View does not allow much user interaction - zoom in & zoom out, that’s it basiaclly - even a pan option is not
available in this initial view.
 If you want to have an accurate view of your
path (map projection wise), please use the OpenMapData View with OpenStreetMap (Offline) provider - when you do not
have any additional *map files in your offline maps directory (only the world.map present), then the presentation of the
OpenMapData View is the view you should use. It’s also 100% offline.
If you want to have an accurate view of your
path (map projection wise), please use the OpenMapData View with OpenStreetMap (Offline) provider - when you do not
have any additional *map files in your offline maps directory (only the world.map present), then the presentation of the
OpenMapData View is the view you should use. It’s also 100% offline.
When you compare both screenshots here the difference is quite noticeable! (Even if you ignore all the other difference
like: compass, map attribution or the different styling of path & background-path rendering.)