Multi Views
Customize your GPSLogger II Screen
Overview
GPSLogger offers multiple ways to allow you to see the different data simultaneously. The simplest way is to enable two additional views beside the main view.
As already described in the Main Views Section it’s possible to start GPSLogger with additional views (or temporary enable/disable them via the main menu) and adjust the aspect ratio between the main and the additional views. You can think of each of the screen parts as a container, that is capable of showing an own screen instance - just in a different size. The alignment of the three views depends on the orientation of your decide (portrait or landscape).
With the concept of allowing up to three different views to be present at once I had the opinion that this would give the user all the flexibility that is needed. As more external sensors has become available, there was the need to offer an additional approach to customize the available screens.
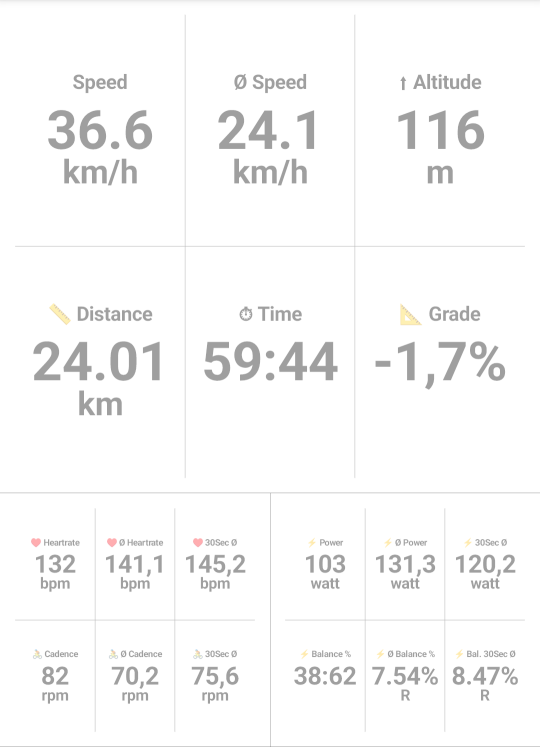 So beside the possibility to show 3 different views on the main application screen, four completely free configurable
views have been added. These views called Multi View I - Multi View IV. For each ot this four views you
can select up to 6 different values tobe displayed.
So beside the possibility to show 3 different views on the main application screen, four completely free configurable
views have been added. These views called Multi View I - Multi View IV. For each ot this four views you
can select up to 6 different values tobe displayed.
Since you can of course also show different Multi Views as one of the three main views, you have the option to configure & show up to 18 different values on your main screen (3 x 6 values). That might already feels like sitting in the cockpit of a plane.
But of course you don’t have to specify for each multi view 6 different values - the size of each value will be adjusted based on the overall screen space, since each value will consume the same space. So the layout of the views is totally dynamic.
To make the setup process even more complex the multi-view field definitions also support the multiple profiles feature.
So for each of your activities you can define a different set of multi-view fields.
Available Fields for Multi Views
| Field | Icon | Description |
|---|---|---|
| Clock | 🕒 | showing the current time |
| Speed | showing the current speed | |
| Ø Speed | if recording, this will show the average speed | |
| Total Distance | 📏 | if recording, this will show the total distance |
| Elapsed Time/Duration | ⏱ | if recording, this will show the total time (excluding breaks) |
| Altitude | ⬆ | current elevation (including corrections/adjustments) |
| Course | 🧭 | current direction/heading |
| Course (simple) [N,E,S,W] | 🧭 | Simple/textual course information N, NNE, NE, ENE, E, ESE, SE, SSE, S, SSW, SW, WSW, W, WNW, NW, NNW |
| Ascent | ⛰⬆ | the total sum of altitude that was gained over time |
| Descent | ⛰⬇ | the total sum of altitude that was lost over time |
| Grade | 📐 | the current slope (based in the previous und current elevation) |
| VAM | ↗ | The current VAM value (see Climb View for details) |
| Next Turn | when a navigation path that contains turn-by-turn information is loaded - additional the distance to the next waypoint will be shown | |
| Relative Speed | This is the speed you approaching to the current active waypoint (next navigation target). E.g. when you are sailing, it can be very interesting to know your relative speed to the target | |
| Distance to Finish | 🏁 | when a navigation path is loaded the remaining distance till the end of this navigation path |
| # BTLE | Number of currently detected BTLE Beacons with a specific UUID | |
| Gear | ⚙ | numeric front & rear gear information (if Di2 is bound) |
| Ratio | ⚙ | the resulting gear ratio (if Di2 is bound) |
| Gear Schema | ⚙ | visual front & rear gear information (if Di2 is bound) |
| Di2 Battery | 🔋 | The current battery status of your Di2 System |
| Heartrate | ♥ | your current heartrate (in beats per minute or %) as provided via an external sensor |
| Ø Heartrate | ♥ | if recording, this will show the average heartrate |
| last 3sec Ø Heartrate | ♥ | if recording, this will show the average heartrate of the past 3 seconds |
| last 10sec Ø Heartrate | ♥ | if recording, this will show the average heartrate of the past 10 seconds |
| last 30sec Ø Heartrate | ♥ | if recording, this will show the average heartrate of the past 30 seconds |
| Cadence | 🚴 | your current cadence (in rotations per minute) as provided via an external sensor |
| Ø Cadence | 🚴 | same as for ♥ |
| last 3sec Ø Cadence | 🚴 | same as for ♥ |
| last 10sec Ø Cadence | 🚴 | same as for ♥ |
| last 30sec Ø Cadence | 🚴 | same as for ♥ |
| Power | ⚡ | your current cycling power (in watt) as provided via an external sensor |
| Ø Power | ⚡ | same as for ♥ |
| last 3sec Ø Power | ⚡ | same as for ♥ |
| last 10sec Ø Power | ⚡ | same as for ♥ |
| last 30sec Ø Power | ⚡ | same asfor ♥ |
| Power Balance L/R in % | ⚡‑Bal. | balance between Left & Right leg from the cycling power when provided from the external sensor |
| Ø Power Balance L/R in % | ⚡‑Bal. | same as for ♥ |
| last 3sec Ø Power Balance | ⚡‑Bal. | same as for ♥ |
| last 10sec Ø Power Balance | ⚡‑Bal. | same as for ♥ |
| last 30sec Ø Power Balance | ⚡‑Bal. | same as for ♥ |
| Stoke Rate | 🚣 | your current rowing stroke rate (in stokes per minute) as provided via an external sensor |
| Ø Stoke Rate | 🚣 | same as for ♥ |
| last 3sec Ø Stoke Rate | 🚣 | same as for ♥ |
| last 10sec Ø Stoke Rate | 🚣 | same as for ♥ |
| last 30sec Ø Stoke Rate | 🚣 | same as for ♥ |
| Stoke Count | 🚣 | total Stoke count of rowing session |
| Stoke Distance | 🚣 | total Stroke distance of rowing session |
| Max Speed | V 📈 | The maximum speed during your current activity |
| Max Grade | 📐 📈 | The maximum grade during your current activity |
| Max Heartrate | ♥ 📈 | The maximum heartrate during your current activity |
| Max Cadence | 🚴 📈 | The maximum bike cadence during your current activity |
| Max Stroke Rate | 🚣 📈 | The maximum rowing machine stroke rate during your current activity |
| Max Power | ⚡ 📈 | The maximum bike power during your current activity - Please note it does not make sense to show a maximum bike power balance value, since it’s probably always L100%/R100% |
| Speed last 10sec Max | V 📈 | The maximum speed in the last 10 seconds |
| Grade last 10sec Max | 📐 📈 | The maximum grade in the last 10 seconds |
| Heartrate last 10sec Max | ♥ 📈 | The maximum heartrate in the last 10 seconds |
| Cadence last 10sec Max | 🚴 📈 | The maximum bike cadence in the last 10 seconds |
| Stroke Rate last 10sec Max | 🚣 📈 | The maximum rowing machine stroke rate in the last 10 seconds |
| Power last 10sec Max | ⚡ 📈 | The maximum bike power in the last 10 seconds |
| Power Balance last 10sec Max | ⚡‑Bal. 📈 | The maximum power balance (L/R) in the last 10 seconds |
| Speed last 30sec Max | V📈 | The maximum speed in the last 30 seconds |
| Grade last 30sec Max | 📐 📈 | The maximum grade in the last 30 seconds |
| Heartrate last 30sec Max | ♥ 📈 | The maximum heartrate in the last 30 seconds |
| Cadence last 30sec Max | 🚴 📈 | The maximum bike cadence in the last 30 seconds |
| Stroke Rate last 30sec Max | 🚣 📈 | The maximum rowing machine stroke rate in the last 30 seconds |
| Power last 30sec Max | ⚡ 📈 | The maximum bike power in the last 30 seconds |
| Power Balance last 30sec Max | ⚡‑Bal. 📈 | The maximum maximum power balance (L/R) in the last 30 seconds |
Is there any value you miss? Please let me know!
As example - for cycling, I have the map as main view and have the three different multi views configured to show 4 different fields each:
- View 1:
- Power
- Heartrate
- 30Sec Ø Power
- Speed
- View 2:
- Distance
- Distance to Finish
- Elapsed Time
- Next Navigation Turn
- View 3:
- Accent
- Grade
- VAM
- Next Navigation Turn